SATs Results and pupil outcomes
Pupil outcomes for end of KS2 SATs:
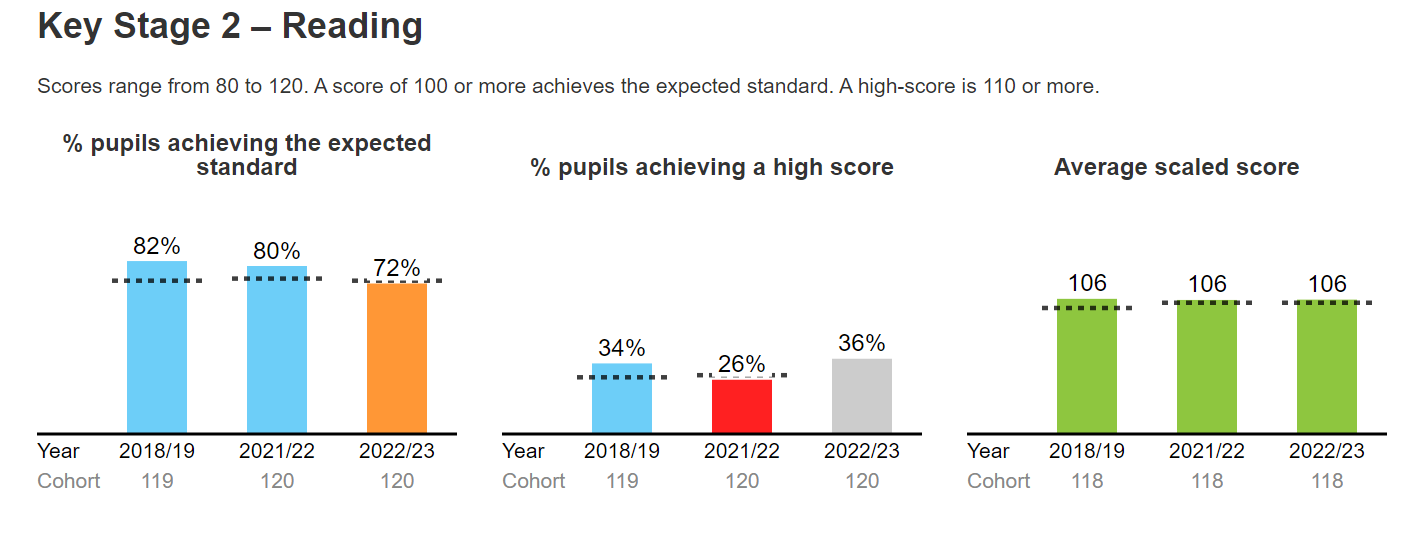
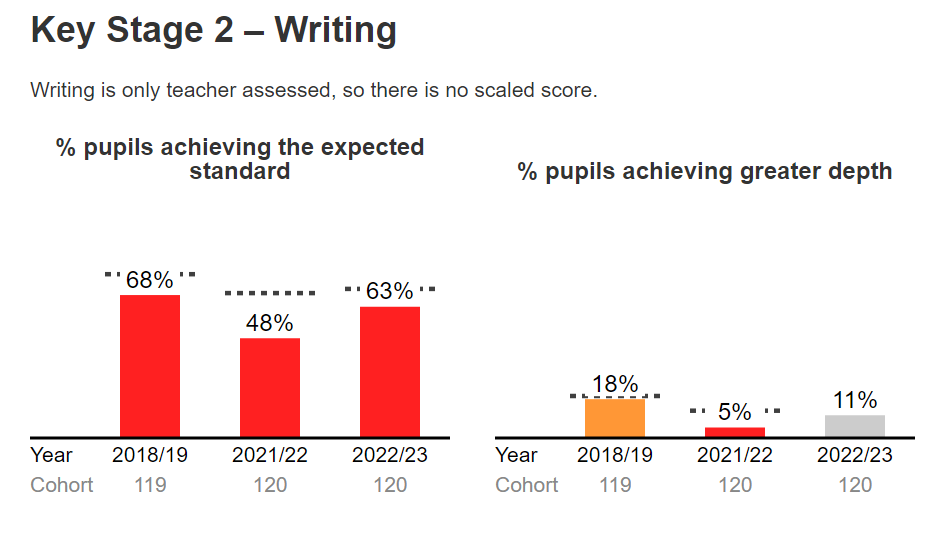
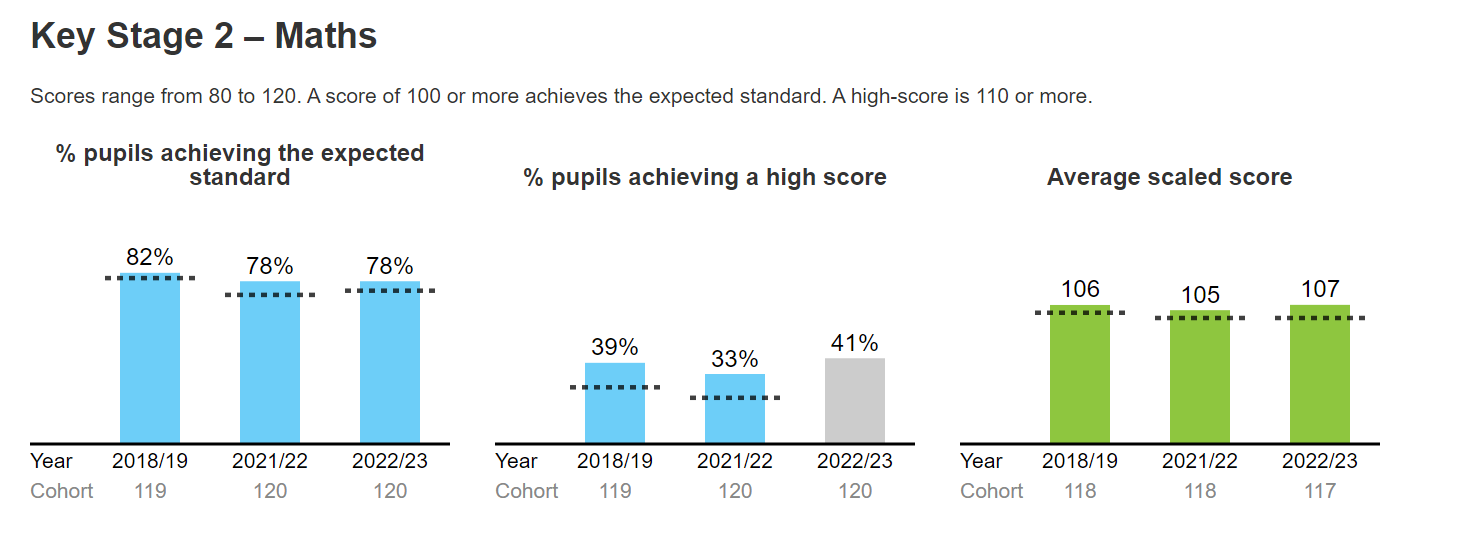
Key stage 2 attainment 2023: national headlines
Pupil outcomes for end of year 4 MTC:
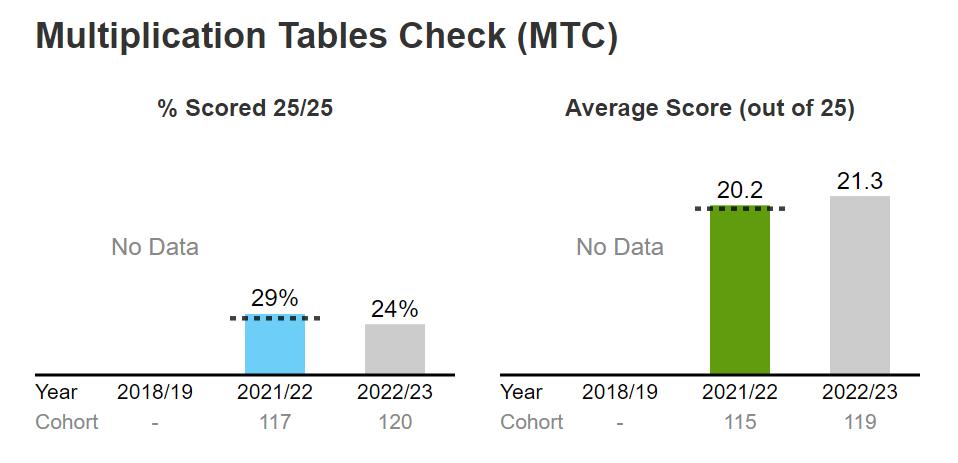
*Official statistics for 2021/2022, available from: https://explore-education-statistics.service.gov.uk/find-statistics/multiplication-tables-check-attainment/2021-22