Loughton School
News & Events
Comuting - Excel
This week Year 5 have been…
Inputting data to Excel!
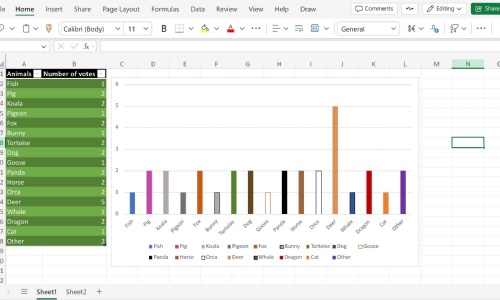
We have been learning to successfully use Excel to organise, store and represent data! Using the data we collected about our heart rates in science, we have input our data, transformed our data into a table and turned that table into a bar chart, all using Excel!
We have even collected our own data to showcase our new skills. We created tally charts about our favourite things, including ice-cream flavours, cartoons and sports to then create tables and charts from. Formatting our charts was the fun part, deciding the colours and style to make them.